Spectroscopy of mass-selected clusters
Determination of structure and dynamics of metal-and semiconductor clusters

Cluster physics has two goals: on one hand it studies the development of solid-state properties like crystal structure, photoabsorption behavior, or magnetism as a function of cluster size. On the other hand, clusters can be used as simple model systems for the examination of fundamental phenomena as e.g. electron-electron correlation or electron-ion-coupling.
In both cases, it is necessary to characterize free mass-selected clusters as comprehensively as possible. A number of spectroscopical methods are available for this purpose. In our group mainly photoabsorption spectroscopy and photoelectron spectroscopy are used. The first allows one to study excited states, while the latter can be used to determine the electron density of states of the cluster in the ground state.
Using fs-laser pulses both methods are applied to do time-resolved measurements of ultrafast processes.
Experimental Setup
The spectroscopic experiments are carried out on three very similar apparatuses, which mainly differ in the (currently) used cluster sources and other modular attachments:
- Sodium apparatus: Double reflectron time-of-flight mass spectrometer with gas aggregation cluster source and thermalization unit. At this time photo fragmentation experiments were carried out to determine the caloric properties of the clusters
- Silicon/Carbon apparatus: Reflectron time-of-flight mass spectrometer with laser evaporation source and photoelectron spectrometer. At the moment, high-resolution photoelectron spectroscopy as well as ultra-fast spectroscopy on smaller silicon and carbon clusters are carried out here
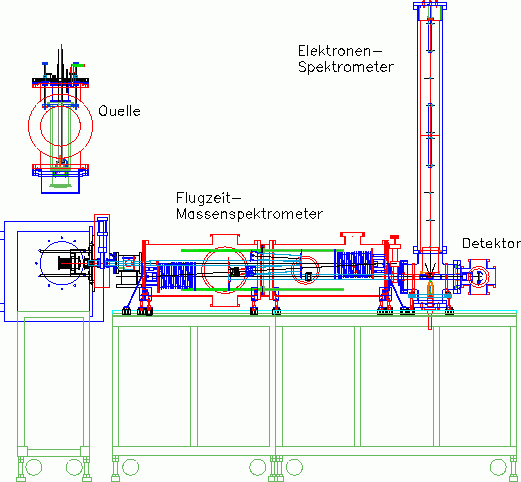
- New apparatus: Double reflectron time-of-flight mass spectrometer with magnetron sputtering gas aggregation cluster source and photoelectron spectrometer. This third-generation cluster apparatus is used to measure UV photoelectron spectra and photo fragmentation spectra on clusters of a very wide mass range.
Representing the apparatus, the new apparatus will be described in more detail here.
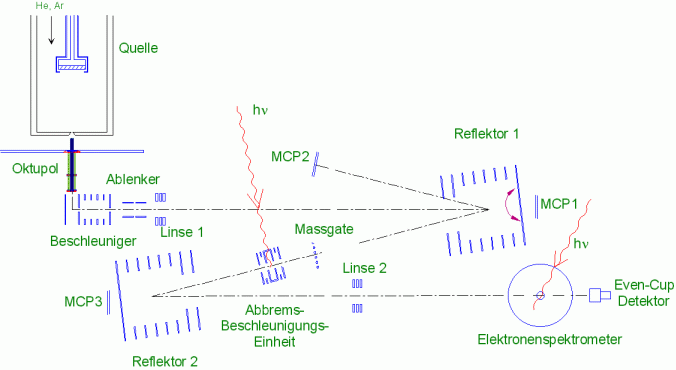
In photo fragmentation experiments, the cluster ions behind the mass gate are irradiated by a laser in the static deceleration-acceleration unit; the second reflector then serves as a mass spectrometer with which the fragment distribution can be measured. For the recording of photoelectron spectra, the clusters are strongly decelerated shortly before the interaction zone of the electron spectrometer and then irradiated with a laser. Electrons emitted by the cluster are guided by a magnetic field through a long drift tube to a detector and detected there. The kinetic energy of the electrons is then calculated from the time of flight; since the photon energy is known, the binding energy of the electrons can be calculated from it.
Absorption spectroscopy
Alkali Clusters
- The temperature dependence of all spectra of Nan+, with 3 ≤ n ≤ 16 are given in:
- Ch. Ellert, M. Schmidt, Ch. Schmitt, Th. Reiners, and H.Haberland, Temperature dependence of the optical response of small, open shell sodium clusters, Phys. Rev. Lett. 75, 1731 (1995)
- M. Schmidt, Ch. Ellert, W. Kronmüller, and H. Haberland, Temperature Dependence of the Optical Response of Sodium Cluster Ions, Nan+, with 3 ≤ n ≤ 16, Phys. Rev. B 1999
- The size dependence, and a moment analysis for 3 ≤ n ≤ 64 can be found in:
- Th. Reiners, Ch. Ellert, M. Schmidt and H. Haberland, Size dependence of the optical response of spherical sodium clusters, Phys. Rev. Lett. 27, 1558 (1995)
- M.Schmidt, and H. Haberland, Optical Spectra and their Moments for Sodium Clusters, Nan+, with 3 ≤ n ≤ 64, European Physical Journal D 1999
- The charge dependence of three spherical clusters is given in:
Ch. Schmitt, Ch. Ellert, M. Schmidt, and H. Haberland, Doubly charged sodium clusters: plasmon response and photo production, Z. Phys. D42, 145 (1997) - The data of 1 to 3 are summarized in:
H. Haberland, Optical and Thermal Properties of Sodium Clusters, in Metal Clusters , W. Ekardt, ed. John Wiley and Sons Ltd - There exist close analogies between metal clusters and Nuclear Physics, as both nuclei and hot metal clusters can be treated as finite Fermion systems:
H. Haberland, Metal clusters and nuclei, some similarities and differences, Nuclear Physics A 1999 - For the negatively charged, spherical cluster Na91-, the optical response, as well as the branching ratio for atom with respect to electron emission, has been measured:
Th. Reiners and H. Haberland, Plasmon Enhanced Electron and Atom Emission from a Spherical Sodium Cluster: Na91-, Phys.Rev. Lett. 77, 2440 (1996) - Li-clusters:
Ch. Ellert, M. Schmidt, Ch. Schmitt, and H. Haberland, Reduced oscillator strength in lithium atoms, clusters, and bulk, Phys. Rev. B 1999 -
Cs-clusters:
Ch. Ellert, M. Schmidt, Ch. Schmitt, and H. Haberland, Optical response of small, closed shell Cs clusters ions, Surface Science Reviews and Letters 3, 515 (1996)
Photoelectron spectroscopy
Structure studies using ns-lasers
Metal clusters: sodium
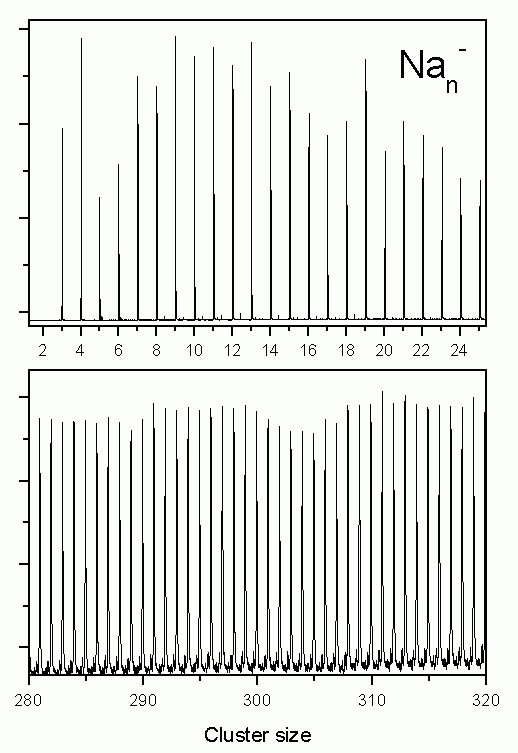
The most simple model for the electronic structure of metals is the free electron model. It assumes that the electrons can move freely through the lattice. If this is true as well for a metal cluster, this particle can be seen as an ideal realization of the quantum mechanics problem of several particles in a spherical box potential. Indeed it is possible to explain many properties of metal clusters, e.g. their stability using the free electron model. In the figure below a mass spectrum of sodium clusters is shown which as early as 1984 has been measured by W.de Heer and W.Knight. It has been obtained under experimental conditions where clusters with high stability exhibit an enhanced intensity. The maxima observed can be easily explained in the free electron model: in the spherical potential the single particle solutions of the Schrödinger equation are the angular momentum eigenstates. Degenerate states with equal angular momentum l, but different magnetic quantum number m form a so-called shell. Exactly as in the case of atoms the stability of the system is high if all occupied shells are closed.
The electronic configuration of the especially stable clusters observed here is for example (the shells are indexed by a radial and a angular momentum quantum number)
- Na8: 1s2 1p6
- Na20: 1s2 1p61d10 2s2
- Na40: 1s2 1p61d10 2s2 1f14 2p6
- Na58: 1s2 1p61d10 2s2 1f14 2p6 1g18
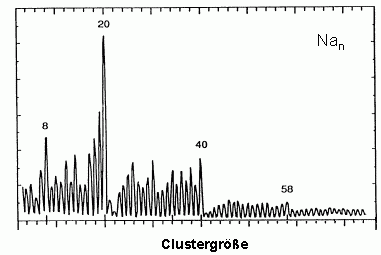
The figure on the right shows a mass spectrum of positively charged sodium clusters produced by the gas aggregation source. The clusters are cold (about 100 K) and therefore exhibit a perfectly structureless distribution (only in the case of very hot clusters, which after the production evaporate off some atoms, cluster with high binding energies will show enhanced intensities in a mass spectrum).
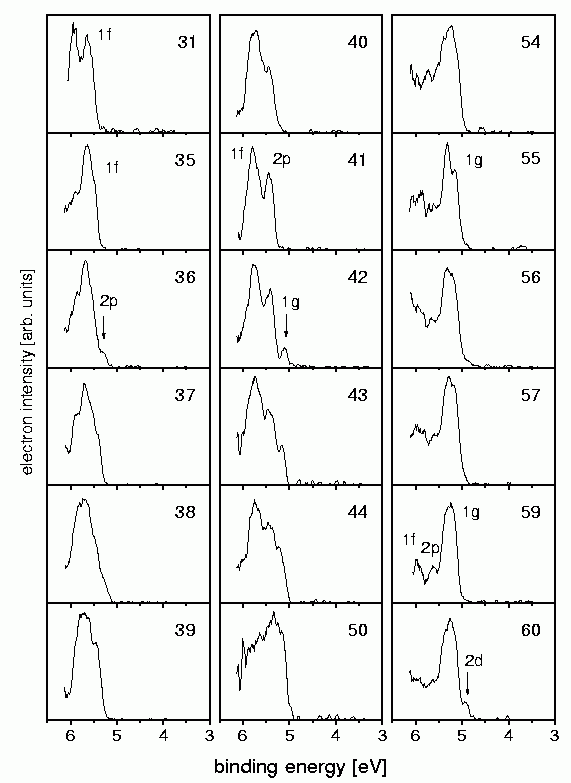
The photoelectron spectra measured are shown on the left. Indeed one can see the electron shells which have been expected for (nearly) free electrons.
In the case of Na41+ (which has 40 electrons and hence the electronic configurationNa40: 1s2 1p61d10 2s2 1f14 2p6) for example the twouppermost shells 1f and 2p are visible. As these shells are closed, the next electron has to occupy the 1g-shell (which is the case for Na42+. Accordingly in the case of size 59 one sees the closure of the 1g-shell, and for size 60 the opening of the 2d-shell. This demonstrates that the electrons in a sodium cluster indeed occupy orbitals that are similar to the ones depicted above (published in Phys.Rev.A. 65, 063201 (2002) ).
Recently we have started to study negatively charged sodium clusters. These are even more interesting as due to their smaller ionization potential at a given photon energy one can image a larger part of the electron state density. They are, however, slightly more difficult to produce than positively charged clusters. After some optimizations of the source, they can now be produced with high intensity as well. The figure on the left shows two examples of mass distributions.
The corresponding photoelectron spectra will be published soon.
Other Metals
The free electron models also work well for the heavier alkali metals and for the noble metals (which are monovalent as well). For other metals, there might be deviations due to the strong influence of the d-bands or due to the higher electron density in the case of di- or trivalent metals.
One example is the trivalent aluminum. There are two reasons to study this metal. On one hand one would like to measure the electronic structure of smaller clusters in order to see whether there are deviations from the simple electron shell structure; on the other hand, big clusters are interesting, where one can check whether there exists a certain size limit beyond which the cluster just behave like classical metal spheres.
Some examples of such photoelectron spectra are shown here. One can notice quite strongly structured spectra for clusters with up to about 100 atoms. These structures cannot really be identified in view of the solutions for the spherical box potential, as the angular momentum eigenstates are strongly perturbed. A simple example is Al13-, which has 40 valence electrons and therefore like Na40 should have the configuration 1s2 1p6 1d10 2s21f14 2p6. Calculations show that the single visible peak consists of the shells 2s,1f and 2p. So there seems to be some remainder of the shell structure, but unlike in the case of sodium single shells cannot be identified anymore.
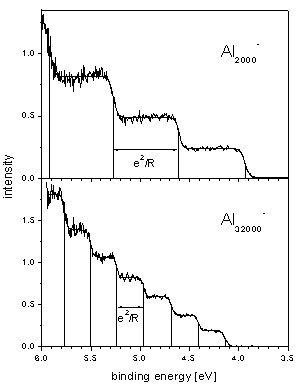
In the spectra of the bigger cluster, one can see staircase-like structures. These are shown again in the next figure.
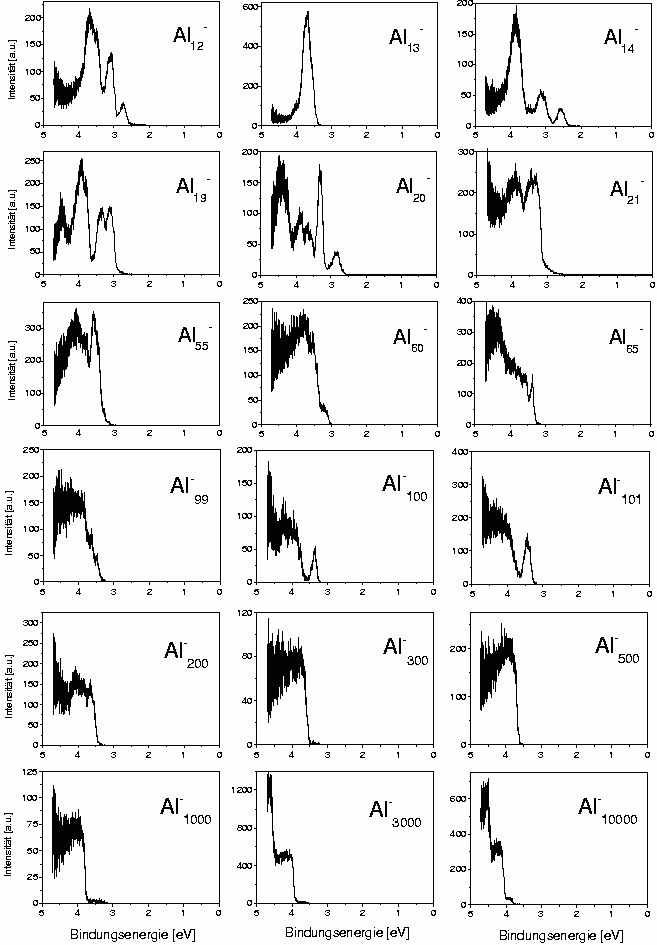
The reason for these steps is multiple ionization: the negative cluster absorbs a photon and emits an electron; the now neutral cluster can absorb another photon and again emit an electron, and so on.
As the ionization potential increases with the charge of the cluster the spectra of the different charge states are shifted with respect to one another. This way one can measure up to seven different thresholds in one spectrum. These values can then be compared for example with theoretical values for small classical metal spheres. (published in Phys.Rev.B 66, 041404 R (2002) ).
[1] W.D.Knight, K.Clemenger, W.A.de Heer, W.A.Saunders, M.Y.Chou, and M.L.Cohen, Phys.Rev.Lett.52, 2141 (1984)
Semiconductor clusters
Semiconductors have an electronic structure significantly different from that of metals. The binding has a strongly covalent character, and therefore the spatial electron distribution in the bulk is much more structured. There exists a band gap between the full valence band and the empty conduction band of about 1 eV; this is actually the characteristic property of a semiconductor.
For a cluster the question arises how this well-known property of the bulk develops with cluster size. Furthermore, large semiconductor clusters are interesting as they can be used as model systems for the study of a few electrons in a relatively large box. The electrons in the conduction band are (at least in the bulk) very mobile, like the conduction electrons in a metal. In this sense semiconductor clusters with their empty conduction band can be seen as "empty" metal clusters. By doping one can insert a defined number of electrons into these systems and study their behavior. Experiments of this kind have already been done by many groups for small crystallites and semiconductor structures, so-called "quantum dots". In these systems, which often are larger than 10 nm, quantum size effects are not yet dominant. For this reason, we are planning to do experiments on free, size-selected clusters with diameters of 1 nm to 10 nm.
We have chosen to start with silicon due to its technical importance and also to the wealth of experimental and theoretical data already available.
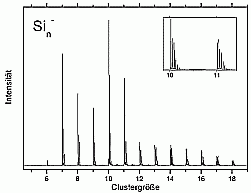
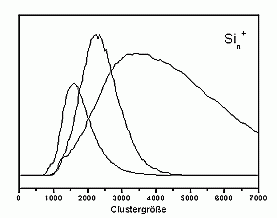
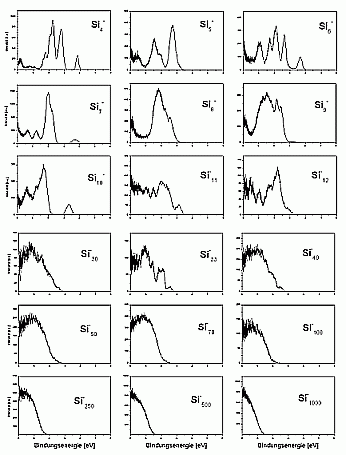
For larger clusters the spectra are very smooth, which is on one hand, due to the convergence towards the bulk spectrum, which is smooth as well. On the other hand it is probably also due to the fact that for these cluster sizes many possible isomers exist, which means that each measured spectrum is an average over several (maybe slightly different) spectra.
A band gap was not observed even for the biggest cluster studied up to now (Si3000-). In principle, it would be possible to observe it in the photoelectron spectra. If the cluster had a bulk-like density of states, it should have a filled valence band and an empty conduction band. The one additional electron of the negatively charged cluster would then occupy the lowest state of the conductance band and make it visible this way. The reason why this is not observed is the existence of surface states: the unsaturated bonds on the cluster surface form states directly in the band gap. Half of these states are occupied, and there will be only a very small gap between the highest occupied and the lowest unoccupied state, which is not resolved in the experiment.
One possibility to get rid of these surface states is to saturate the free bonds by binding hydrogen or oxygen atoms. Experiments to study such passivated silicon clusters are underway.
Carbon clusters
Carbon is a special element. Due to its ability to form single, double
and triple bonds carbon compounds exhibit an enormous structural diversity.
Actually, they define a whole field of science, organic chemistry. Pure
carbon clusters exhibit a wealth of different structures for the same reason.
An impression of this diversity can be obtained from the figure below,
which shows some (not all!) possible isomers of C20.
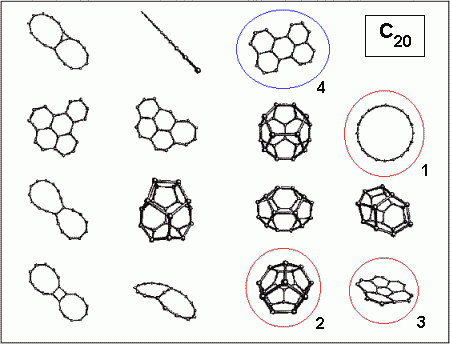
The geometrical structure of C20 has recently been discussed
very intensively. Experimentally only ring structures have been found,
with a strong preference for the monocyclic ring (1). As has been shown
by many calculations, two other isomers, a symmetric cage (2) and a bowl
(3) should be energetically very close to the ring. The cage (2) actually
is a dodecahedron consisting of twelve five-rings, and therefore the smallest
possible fullerene, that is the smallest brother of the renowned C60 [1].
Due to its smallness and the resulting unfavourable binding angles
it should be strongly strained; it was even doubted whether it exists at
all.
In a cooperation with Prof.
Prinzbach (organic chemistry, university of Freiburg) the existence
of fullerene-C20 could now be demonstrated for the first time
(and the existence of the bowl isomer as well). The group of Prof. Prinzbach
succeeded in synthesizing a bromine-passivated form of the C20 cage
[3]. In our group a special gas discharge ion
source was constructed, in which the bromine atoms are detached from the
cage and the cage gets negatively charged. The C20 -anion
produced in this way was then mass-selected and studied by high-resolution
electron spectroscopy. For completeness reasons two other isomers were
studied as well: C20 -anions produced from a chemically synthesized
brominated bowl isomer (made available by Prof. Scott [4]),
and C20-anions produced by a standard laser evaporation cluster
source.
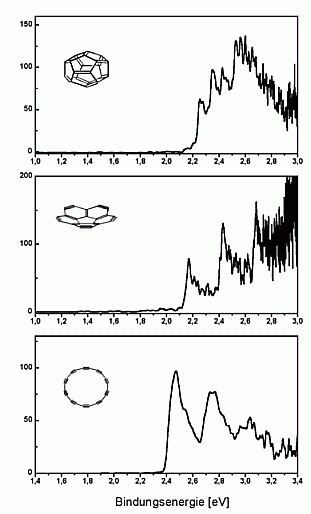
The spectra obtained are shown on the left. In all spectra one can
see vibrational progressions, which are significantly different for the
three isomers. From this one can deduce that the cage and the bowl have
survived the gas phase debromination (published in Nature 407, 60 (2000)).
We have measured UV-photoelectron spectra of the fullerene-C20
as well, which is shown on the right. The spectrum looks quite similar
to that of C60 and seems to demonstrate that C20
like C60 exhibits a large HOMO-LUMO-gap. This is, however, not
the case: as can be seen in the high-resolution spectrum above, the first
excited state of the neutral cluster lies already at about 0.3 eV above
the ground state.
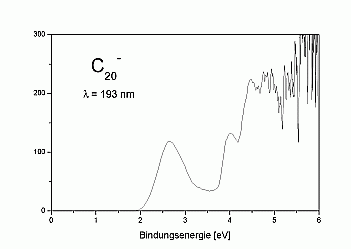
[5]). Futhermore we have started to characterize
a fourth isomer of C20: the graphitic isomer (4).
[1] H.W.Kroto, J.R.heath, C.O'Brien, R.F.Curl, and
R.E.Smalley, Nature 318, 162 (1985)
[2] R.O.Jones, J.Chem.Phys. 110, 5189 (1999)
[2] H. Prinzbach, K. Weber, Angew. Chem. Int.
Ed. Engl. 33, 2239 (1994)
[3] L.T. Scott, P. C. Cheng, M. M. Hashemi, M.
S. Bratcher, D. T. Meyer, H. B. Warren, J. Am. Chem. Soc. 119, 10963 (1997)
[4] M.Saito and O.Sugino, Phys.Rev.B 61, 12674
(2000)
