Cluster Melting
Determination of the melting point and heat capacity for mass-selected Na cluster ions
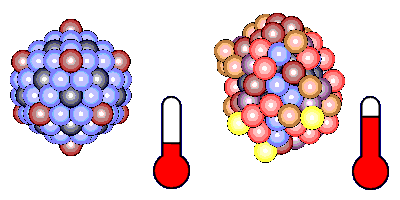
Many properties of clusters are different from those of the bulk, like binding energies, work function, crystalline structure, optical, magnetic or chemical behavior.
One important property which is strongly size-dependent is the melting point. Small particles melt at significantly lower temperatures than bulk material, which is due to the fact that the surface energy of liquids is lower than that of solids - and small particles mainly consist of the surface.
The interesting question is how one can measure the melting point of free particles in the vacuum. This is explained below.
Introduction: melting point, latent heat of melting, caloric curve
Measuring the melting point of water is not difficult: You cool the water and observe at what temperature it becomes solid. But how do you measure a melting point if you cannot watch the sample under investigation freeze?
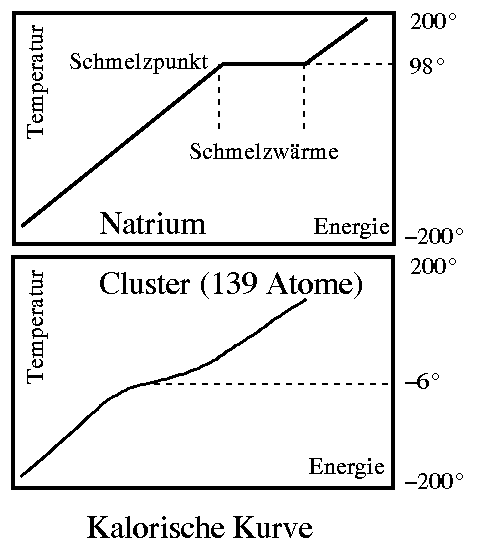
For a sample of a few grams or at least milligrams, the following setup is used: it is well thermally insulated and electrically heated while its temperature is measured. Normally, the temperature rises continuously while the heat is kept constant. However, a special phenomenon occurs at the melting point: The temperature lingers there for a while without rising further, even though the sample continues to be heated. This is how melting points can be identified. The energy that has to be supplied without affecting the temperature is called heat of fusion or latent heat. It is needed to dissolve the lattice structure and therefore does not benefit the heating. This property of melting processes is the reason why an ice-cooled beverage maintains the temperature of zero degrees as long as there is ice in it, even though it is constantly heated by the warm environment.
The relationship between the energy from the heating and the temperature of the sample is called the caloric curve (see figure). The melting point can be seen as a step in it and the width of the step is the heat of fusion. The device described is a calorimeter. It is a measuring instrument that allows accurate determination of melting points without having to watch the sample melt. In a normal calorimeter, however, one needs a few grams or at least milligrams of material for the measurement. Our clusters are about twenty orders of magnitude smaller!
How do you build a calorimeter for such small samples?
To do this, we reverse the measurement principle: We make clusters with a known temperature and measure the energy they contain. In this way, we again obtain the relationship between energy and temperature, i.e. the caloric curve. In it, we see the steps typical for melting processes and read off the melting point and heat of fusion.
The measurement principle
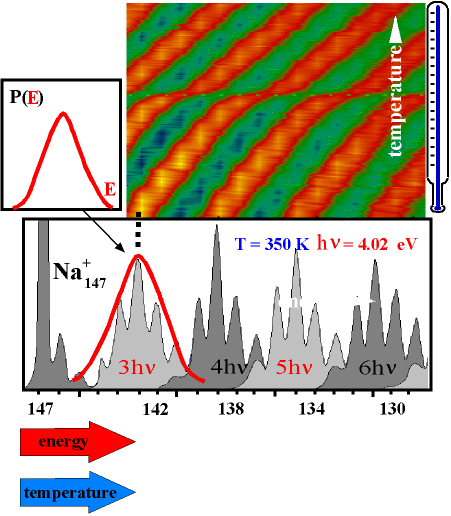
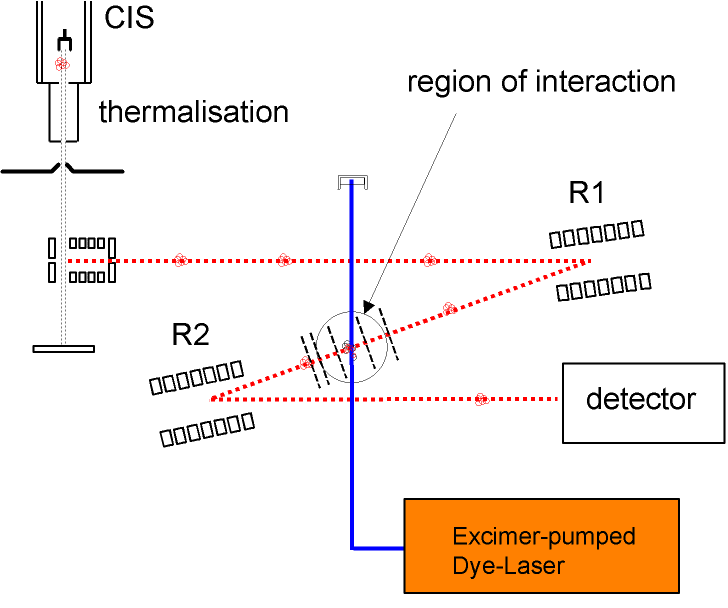
Our apparatus allows the measurement of the energy distribution of a thermalized cluster ensemble. After the cluster has absorbed additional energy by absorbing photons, it starts to evaporate atoms. The resulting fragments are detected in the detector - a fragment spectrum is obtained as shown in the figure below for Na147. A clear periodic structure in the fragment intensities is observed.
One can now realize that this structure just represents the energy distribution of the parent cluster P(E): per photon the cluster receives a constant amount of energy. Now it depends on the internal energy before absorption how many atoms it will evaporate. Clusters from the "fringes" of the distribution P(E) are rarer, but also evaporate more or fewer atoms than those close to the mean energy because of their increased or decreased energy compared to the mean. Thus, the intensities of the fragment peaks allow a direct conclusion on the internal energy distribution of the parent cluster.
In this way, the mass scale in the fragment spectrum can be converted into an energy scale.
Experimental Setup
Cluster Ion Source (CIS)
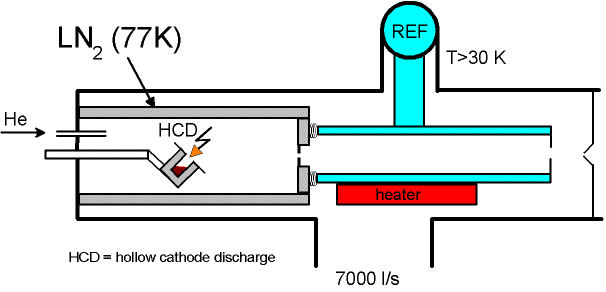
Mass Spectrometer
Results
Cluster Size Dependence of Melting Temperatures
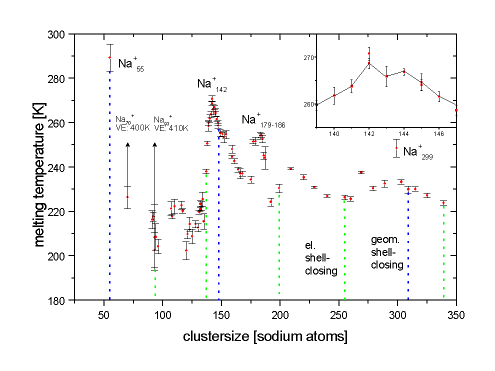
The size-dependent plotted melting points show a distinct structure which is not fully understood so far. The position of the maxima cannot be satisfactorily explained by either electronic or geometric shell terminations - in fact the latent heat of melting exhibits maxima at geometric shell closings, the size-dependence of the melting temperature is more complicated.
Negative Heat Capacity for Na147
For considering the thermodynamic properties of finite systems, it is important to distinguish between the canonical and micro-canonical description, since the different types of ensemble averaging generally give different results. For example, the canonical heat capacity is necessarily positive, while the micro-canonical heat capacity for finite systems can become negative in the region of a phase transition. This could be observed for a Na cluster of 147 atoms.
It has been shown elsewhere that in the measurement the distribution of the internal energy pT(E) is mapped into the mass spectrum by the fragmentation process. From this one obtains in principle the energy distribution p(E), and from this with
p(E)µW(E) exp(-E/kT)=exp(S/kT-E/kT)
the entropy of a free cluster. However, there is a broadening in the mapping due to two processes: the evaporation of dimers, and most importantly, the statistical nature of the evaporation process. This prevents a direct conversion of the data.
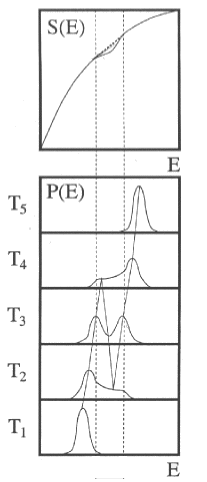
On the other hand, if one calculates the canonical energy distributions from this entropy, one obtains bimodal distributions in the vicinity of the physics transition (T3). Negative heat capacities can therefore be demonstrated using bimodal energy distributions.
To detect negative heat capacity, the photon energy must be cleverly chosen. The fragmentation pattern at the phase transition then shows whether a bimodal energy distribution is present or not. The corresponding photon energy can be calculated analytically from the melting point, latent heat and heat capacity before and after the phase transition. The corresponding measurement on Na147 clearly shows the pattern of bimodal energy distribution which is equivalent to negative micro-canonical heat capacities.
Literature
- M. Schmidt and B. v. Issendorff Gas-phase calorimetry of protonated water clustersPhys. Rev. Lett. 108, 057201 (2012)
- C. Hock, M. Schmidt, and B. v. Issendorff Low-temperature caloric behavior of a free sodium nanoparticle Phys. Rev. B 84, 113401 (2011)
- C. Hock, M. Schmidt, R. Kuhnen, C. Bartels, L. Ma, H. Haberland, and B. v.Issendorff Calorimetric Observation of the Melting of Free Water Nanoparticles at Cryogenic Temperatures Phys. Rev. Lett. 103, 073401 (2009)
- Christian Hock, Christof Bartels, Samuel Straßburg, Martin Schmidt, Hellmut Haberland, Bernd von Issendorff, and Andrés Aguado Premelting and Postmelting in Clusters Phys. Rev. Lett. 102, 043401 (2009)
- C. Hock, S. Straßburg, H. Haberland, B. v. Issendorff, A. Aguado, and M. Schmidt Melting-Point Depression by Insoluble Impurities: A Finite Size Effect Phys. Rev. Lett. 101, 023401 (2008)
- Hellmut Haberland, Thomas Hippler, Jörn Donges, Oleg Kostko, Martin Schmidt, and Bernd von Issendorff Melting of Sodium Clusters: Where Do the Magic Numbers Come from? Phys. Rev. Lett. 94, 035701 (2005)
- M. Schmidt, J. Donges, Th. Hippler, and H. Haberland Influence of Energy and Entropy on the Melting of Sodium Clusters Phys. Rev. Lett. 90, 103401 (2003)
- Martin Schmidt, Hellmut Haberland Phase transitions in clusters Comptes Rendus Physique Volume 3, Issue 3, April 2002, Pages 327-340 (2002)
- Martin Schmidt, Thomas Hippler, Jörn Donges, Werner Kronmüller, Bernd von Issendorff, Hellmut Haberland, and Pierre Labastie Caloric Curve across the Liquid-to-Gas Change for Sodium ClustersPhys. Rev. Lett. 87, 203402 – Published 24 October (2001)
- Martin Schmidt, Robert Kusche, Thomas Hippler, Jörn Donges, Werner Kronmüller, Bernd von Issendorff, and Hellmut Haberland Negative Heat Capacity for a Cluster of 147 Sodium Atoms Phys. Rev. Lett. 86, 1191 (2001)
- Martin Schmidt, Robert Kusche, Bernd von Issendorff & Hellmut Haberland Irregular variations in the melting point of size-selected atomic clusters Nature volume 393, pages 238–240 (1998)
- Martin Schmidt, Robert Kusche, Werner Kronmüller, Bernd von Issendorff, and Hellmut Haberland Experimental Determination of the Melting Point and Heat Capacity for a Free Cluster of 139 Sodium Atoms Phys. Rev. Lett. 79, 99 (1997)
